
Page 469 - e-Book
P. 469
Excitation spectra for S2 at 410 nm
1000
800 (235 nm)
Intensity 600
400
200
0
210 240 270 300 330 360 390
Wavelength (nm)
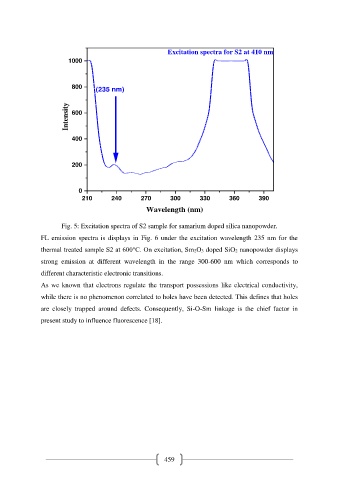
Fig. 5: Excitation spectra of S2 sample for samarium doped silica nanopowder.
FL emission spectra is displays in Fig. 6 under the excitation wavelength 235 nm for the
thermal treated sample S2 at 600℃. On excitation, Sm2O3 doped SiO2 nanopowder displays
strong emission at different wavelength in the range 300-600 nm which corresponds to
different characteristic electronic transitions.
As we known that electrons regulate the transport possessions like electrical conductivity,
while there is no phenomenon correlated to holes have been detected. This defines that holes
are closely trapped around defects. Consequently, Si-O-Sm linkage is the chief factor in
present study to influence fluorescence [18].
459