
Page 465 - e-Book
P. 465
o
S2 at 600 C
(222)
M
(401)
(400)
(440) (622)
Intensity (a.u.) S1 at 300 C
(411)
o
10 15 20 25 30 35 40 45 50 55 60 65 70 75 80
2 Theta (in degree)
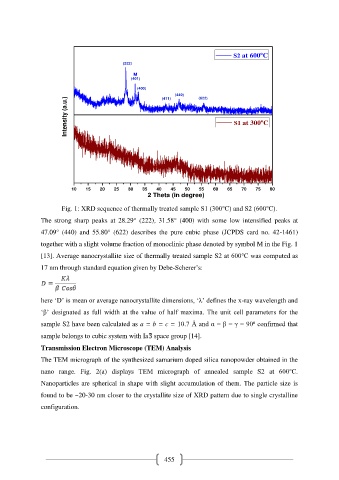
Fig. 1: XRD sequence of thermally treated sample S1 (300℃) and S2 (600℃).
The strong sharp peaks at 28.29° (222), 31.58° (400) with some low intensified peaks at
47.09° (440) and 55.80° (622) describes the pure cubic phase (JCPDS card no. 42-1461)
together with a slight volume fraction of monoclinic phase denoted by symbol M in the Fig. 1
[13]. Average nanocrystallite size of thermally treated sample S2 at 600℃ was computed as
17 nm through standard equation given by Debe-Scherer’s:
here ‘D’ is mean or average nanocrystallite dimensions, ‘λ’ defines the x-ray wavelength and
‘β’ designated as full width at the value of half maxima. The unit cell parameters for the
sample S2 have been calculated as a = b = c = 10.7 Å and α = β = γ = 90⁰ confirmed that
sample belongs to cubic system with Ia space group [14].
Transmission Electron Microscope (TEM) Analysis
The TEM micrograph of the synthesized samarium doped silica nanopowder obtained in the
nano range. Fig. 2(a) displays TEM micrograph of annealed sample S2 at 600℃.
Nanoparticles are spherical in shape with slight accumulation of them. The particle size is
found to be ~20-30 nm closer to the crystallite size of XRD pattern due to single crystalline
configuration.
455