
Page 467 - e-Book
P. 467
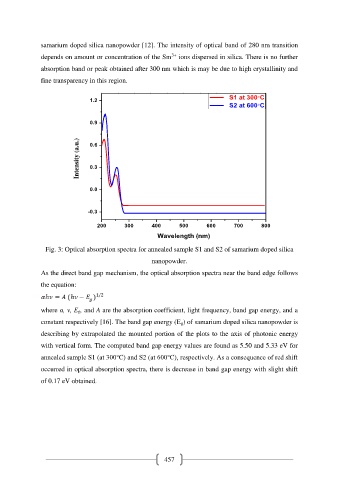
samarium doped silica nanopowder [12]. The intensity of optical band of 280 nm transition
3+
depends on amount or concentration of the Sm ions dispersed in silica. There is no further
absorption band or peak obtained after 300 nm which is may be due to high crystallinity and
fine transparency in this region.
S1 at 300C
1.2
S2 at 600C
0.9
Intensity (a.u.) 0.6
0.3
0.0
-0.3
200 300 400 500 600 700 800
Wavelength (nm)
Fig. 3: Optical absorption spectra for annealed sample S1 and S2 of samarium doped silica
nanopowder.
As the direct band gap mechanism, the optical absorption spectra near the band edge follows
the equation:
where α, ν, Eg, and A are the absorption coefficient, light frequency, band gap energy, and a
constant respectively [16]. The band gap energy (Eg) of samarium doped silica nanopowder is
describing by extrapolated the mounted portion of the plots to the axis of photonic energy
with vertical form. The computed band gap energy values are found as 5.50 and 5.33 eV for
annealed sample S1 (at 300℃) and S2 (at 600℃), respectively. As a consequence of red shift
occurred in optical absorption spectra, there is decrease in band gap energy with slight shift
of 0.17 eV obtained.
457