
Page 468 - e-Book
P. 468
210
S1 at 300C
S2 at 600C
180
150
120
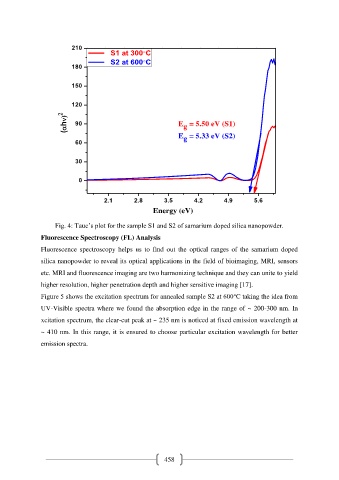
(h 90 E = 5.50 eV (S1)
g
E = 5.33 eV (S2)
g
60
30
0
2.1 2.8 3.5 4.2 4.9 5.6
Energy (eV)
Fig. 4: Tauc’s plot for the sample S1 and S2 of samarium doped silica nanopowder.
Fluorescence Spectroscopy (FL) Analysis
Fluorescence spectroscopy helps us to find out the optical ranges of the samarium doped
silica nanopowder to reveal its optical applications in the field of bioimaging, MRI, sensors
etc. MRI and fluorescence imaging are two harmonizing technique and they can unite to yield
higher resolution, higher penetration depth and higher sensitive imaging [17].
Figure 5 shows the excitation spectrum for annealed sample S2 at 600℃ taking the idea from
UV-Visible spectra where we found the absorption edge in the range of ~ 200-300 nm. In
xcitation spectrum, the clear-cut peak at ~ 235 nm is noticed at fixed emission wavelength at
~ 410 nm. In this range, it is ensured to choose particular excitation wavelength for better
emission spectra.
458