
Page 466 - e-Book
P. 466
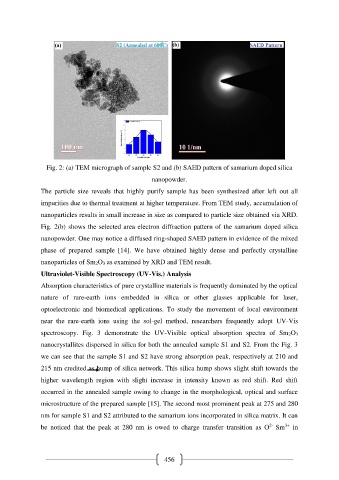
Fig. 2: (a) TEM micrograph of sample S2 and (b) SAED pattern of samarium doped silica
                                                      nanopowder.

               The  particle  size  reveals  that  highly  purify  sample  has  been  synthesized  after  left  out  all

               impurities due to thermal treatment at higher temperature. From TEM study, accumulation of
               nanoparticles results in small increase in size as compared to particle size obtained via XRD.

               Fig. 2(b) shows the selected area electron diffraction pattern of the samarium doped silica
               nanopowder. One may notice a diffused ring-shaped SAED pattern in evidence of the mixed

               phase  of  prepared  sample  [14].  We  have  obtained  highly  dense  and  perfectly  crystalline

               nanoparticles of Sm2O3 as examined by XRD and TEM result.
               Ultraviolet-Visible Spectroscopy (UV-Vis.) Analysis

               Absorption characteristics of pure crystalline materials is frequently dominated by the optical
               nature  of  rare-earth  ions  embedded  in  silica  or  other  glasses  applicable  for  laser,

               optoelectronic  and  biomedical  applications.  To  study  the  movement  of  local  environment

               near  the  rare-earth  ions  using  the  sol-gel  method,  researchers  frequently  adopt  UV-Vis
               spectroscopy.  Fig.  3  demonstrate  the  UV-Visible  optical  absorption  spectra  of  Sm2O3

               nanocrystallites dispersed in silica for both the annealed sample S1 and S2. From the Fig. 3
               we can see that the sample S1 and S2 have strong absorption peak, respectively at 210 and

               215 nm credited as hump of silica network. This silica hump shows slight shift towards the
               higher  wavelength  region  with  slight  increase  in  intensity  known  as  red  shift.  Red  shift

               occurred in the annealed sample owing to change in the morphological, optical and surface

               microstructure of the prepared sample [15]. The second most prominent peak at 275 and 280
               nm for sample S1 and S2 attributed to the samarium ions incorporated in silica matrix. It can

                                                                                                2-
                                                                                                     3+
               be  noticed  that  the  peak  at  280  nm  is  owed  to  charge  transfer  transition  as  O Sm   in


                                                           456