
Page 470 - e-Book
P. 470
0.20 Emission spectra of S2 at excitation
wavelength 235 nm
0.15
0.10 8
Intensity 0.05 5 4
0.00
11 10 7 3 2 1
-0.05 12 9 6
14 13
-0.10 15
-0.15
300 350 400 450 500 550
Wavelength (nm)
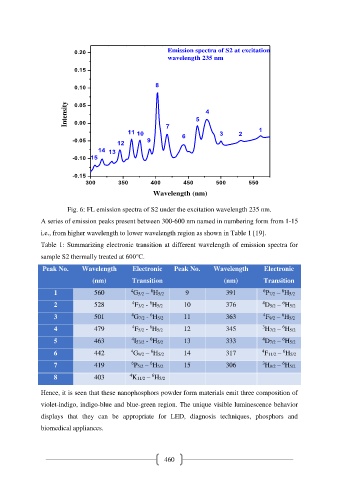
Fig. 6: FL emission spectra of S2 under the excitation wavelength 235 nm.
A series of emission peaks present between 300-600 nm named in numbering form from 1-15
i.e., from higher wavelength to lower wavelength region as shown in Table 1 [19].
Table 1: Summarizing electronic transition at different wavelength of emission spectra for
sample S2 thermally treated at 600℃.
Peak No. Wavelength Electronic Peak No. Wavelength Electronic
(nm) Transition (nm) Transition
6
6
1 560 4 G5/2 – H5/2 9 391 6 P7/2 – H5/2
6
6
2 528 4 F3/2 - H5/2 10 376 4 D5/2 – H5/2
6
6
3 501 4 G7/2 - H5/2 11 363 4 F9/2 – H5/2
6
6
4 479 4 F5/2 - H5/2 12 345 3 H7/2 – H5/2
6
6
5 463 4 I53/2 - H5/2 13 333 4 D7/2 – H5/2
6
6
6 442 4 G9/2 – H5/2 14 317 4 F11/2 – H5/2
6
6
7 419 6 P5/2 – H5/2 15 306 3 H9/2 – H5/2
6
8 403 4 K11/2 – H5/2
Hence, it is seen that these nanophosphors powder form materials emit three composition of
violet-indigo, indigo-blue and blue-green region. The unique visible luminescence behavior
displays that they can be appropriate for LED, diagnosis techniques, phosphors and
biomedical appliances.
460