
Page 429 - e-Book
P. 429
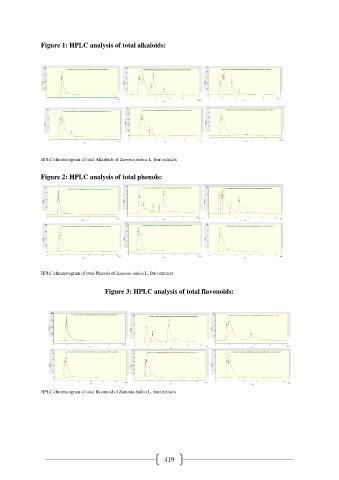
Figure 1: HPLC analysis of total alkaloids:


               HPLC chromatogram of total Alkoloids of Zanonia indica L. fruit extracts


               Figure 2: HPLC analysis of total phenols:


               HPLC chromatogram of total Phenols of Zanonia indica L. fruit extracts


                                      Figure 3: HPLC analysis of total flavonoids:


               HPLC chromatogram of total flavonoid of Zanonia indica L. fruit extracts


                                                           419