Page 414 - e-Book
P. 414

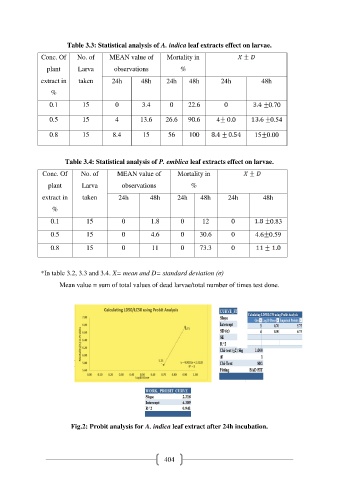
Table 3.3: Statistical analysis of A. indica leaf extracts effect on larvae.

                Conc. Of    No. of     MEAN value of        Mortality in
                 plant      Larva        observations           %

               extract in    taken      24h        48h     24h     48h         24h           48h

                   %
                  0.1         15          0        3.4       0     22.6         0              0.70

                  0.5         15          4       13.6     26.6    90.6      4  0.0             0.54


                  0.8         15         8.4       15       56     100                    15 0.00


                        Table 3.4: Statistical analysis of P. emblica leaf extracts effect on larvae.
                Conc. Of     No. of       MEAN value of        Mortality in

                  plant       Larva         observations            %
                extract in    taken        24h        48h      24h     48h       24h         48h

                   %

                   0.1         15           0         1.8        0      12        0             0.83
                   0.5         15           0         4.6        0     30.6       0        4.6 0.59


                   0.8         15           0         11         0     73.3       0


               *In table 3.2, 3.3 and 3.4. X= mean and D= standard deviation (σ)

                      Mean value = sum of total values of dead larvae/total number of times test done.


                          Fig.2: Probit analysis for A. indica leaf extract after 24h incubation.


                                                           404
   409   410   411   412   413   414   415   416   417   418   419