Page 612 - e-Book
P. 612

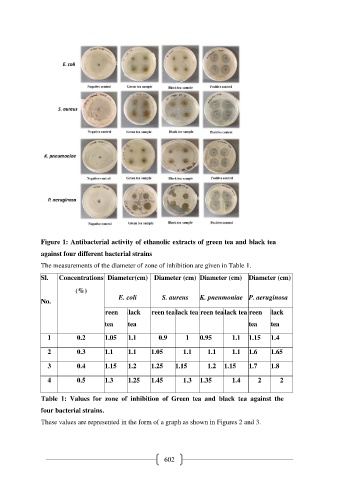
Figure 1: Antibacterial activity of ethanolic extracts of green tea and black tea

               against four different bacterial strains
               The measurements of the diameter of zone of inhibition are given in Table 1.

               Sl.    Concentrations  Diameter(cm)  Diameter (cm)  Diameter (cm)  Diameter (cm)

                            (%)
                                           E. coli        S. aureus    K. pneumoniae  P. aeruginosa
               No.

                                    Green  Black  Green tea lack tea Green tea lack tea Green  Black
                                                                              B
                                                             B
                                      tea     tea                                       tea     tea
                  1         0.2       1.05    1.1        0.9      1    0.95       1.1  1.15     1.4

                  2         0.3       1.1     1.1     1.05       1.1      1.1     1.1  1.6      1.65

                  3         0.4       1.15    1.2     1.25     1.15       1.2  1.15     1.7     1.8

                  4         0.5       1.3     1.25    1.45       1.3  1.35        1.4       2      2


               Table  1:  Values  for  zone  of  inhibition  of  Green  tea  and  black  tea  against  the

               four bacterial strains.

               These values are represented in the form of a graph as shown in Figures 2 and 3.


                                                           602
   607   608   609   610   611   612   613   614   615   616   617