Page 686 - e-Book
P. 686

Bory

               Pinnularia major (Kützing)             2           0          3            Bacillariophyceae
               Rabenhorst

               Synedra capitata Ehrenberg             0           0          6            Bacillariophyceae

               Meridion circulare (Greville)          0           0          12           Bacillariophyceae
               C.Agardh

               Nitzschia palea (Kützing) W.Smith      1           0          165          Bacillariophyceae

               Eugulena viridis Ehrenberg             1           14         225          Euglenophyceae
               Phacus longicauda (Ehrenberg)          0           22         35           Euglenophyceae

               Dujardin
               Table 2: Phytoplankton percentage composition of Jhil Area of Mankundu
                Phytoplankton class percentage composition Jhil
                Phytoplankton Classes                         Pre -monsoon   Monsoon      Post -monsoon


                Chlorophyceae
                                                                  17.64        36.36           25
                Conjugatophyceae                                   5.88          0              0
                Cyanophyceae                                      52.94        36.36           37.5
                Bacillariophyceae
                                                                  17.64         9.09           25
                Euglenophyceae
                                                                   5.88        18.18           12.5

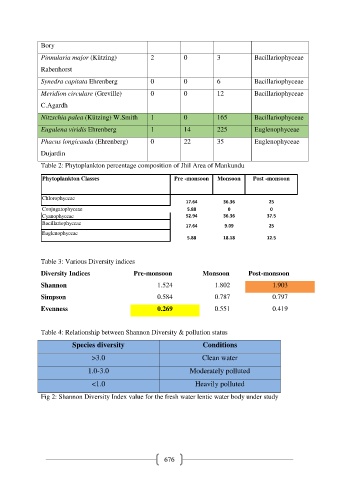
               Table 3: Various Diversity indices

               Diversity Indices                Pre-monsoon             Monsoon         Post-monsoon

               Shannon                                  1.524               1.802                1.903
               Simpson                                  0.584               0.787                0.797

               Evenness                                 0.269               0.551                0.419


               Table 4: Relationship between Shannon Diversity & pollution status

                          Species diversity                             Conditions

                                 >3.0                                   Clean water
                                1.0-3.0                             Moderately polluted

                                 <1.0                                 Heavily polluted

               Fig 2: Shannon Diversity Index value for the fresh water lentic water body under study


                                                           676
   681   682   683   684   685   686   687   688   689   690   691