Page 325 - e-Book
P. 325

Parameters studied           Different study stations at Chandilli Paper mill effluent

                                              contaminated area near river Nagavalli.
                                              Station-1 (S1)       Station-2 (S2)      Station-3 (S3)

                 Colour                       Pale- yellowish      Pale yellow         Light yellow

                                              brown
                 Odour                        Pungent, strong      Filthy smell, little   Filthy smell.

                                              H S smell            pungent
                                                2
                 Temperature, ºC              26.8 ± 2.1           24.6 ± 1.6          22.8 ± 0.8

                 pH                           7.8 ± 0.6            8.1 ± 0.4           8.2 ± 0.4

                 Conductivity, mho/cm         1694.7±17.5          1002.4±31.6         674.2±18.8
                           -1
                 DO (mg.L )                   2.1 ± 0.8            3.3 ± 0.3           4.6 ± 1.1
                 BOD (mg.L )                  108.3 ±11.3          46.8 ± 7.5          26.1 ± 2.8
                            -1
                 COD (mg.L )                  276.4 ± 12.5         86.2 ± 9.3          81.4 ±8.5
                            -1
                 TSS (mg.L )                  819.3 ± 19.6         311.3 ±14.5         118.2±12.4
                            -1
                            -1
                 TDS (mg.L )                  1387.9±22.7          384.8 ± 22.9        185.2±8.8
                 Chlorides, (mg.L )           311.5 ±14.2          91.4 ± 16.8         71.4 ±14.3
                                 -1
                 Hardness (mg.L )             514.2 ±21.6          295.5±19.7          174.5± 5.6
                                -1
                 Fluoride (as F)              1.89 ± 0.8           ND                  ND

                                     -1
                 Total Nitrogen (mg.L )       2.26 ± 0.5           3.16 ± 1.2          2.88 ± 0.92
                                        -1
                 Total Phospahtes (mg.L )     1.26 ± 0.3           2.85±0.71           2.18±0.38
                 Total Sulphate (mg.L )       132.1±9.8            75.8 ± 6.9          31.5 ± 6.1
                                     -1
                               -1
                 Sodium (mg.L )               61.8 ± 5.2           26.5 ± 2.8          24.1 ± 2.7
                                 -1
                 Potassium (mg.L )            49.5 ± 3.8           14.7 ± 4.7          15.2 ± 1.8
                 Mercury [Hg] (mg.L )         0.46±0.07            0.19±0.03           0.08±0.03
                                     -1
                 Cadmium [Cd] (mg.L )         0.32±0.05            0.15 ± 0.02         0.07±0.01
                                      -1
                 Lead (as Pb)                 ND                   ND                  ND


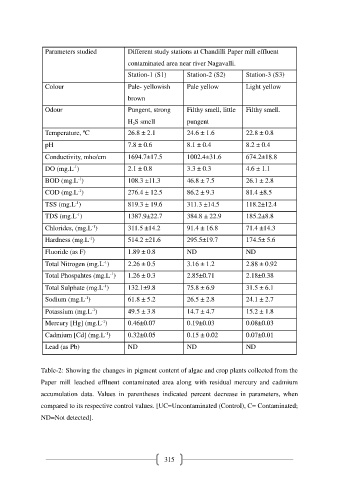
               Table-2: Showing the changes in pigment content of algae and crop plants collected from the

               Paper  mill  leached  effluent  contaminated  area  along  with  residual  mercury  and  cadmium

               accumulation  data.  Values  in  parentheses  indicated  percent  decrease  in  parameters,  when
               compared to its respective control values. [UC=Uncontaminated (Control), C= Contaminated;

               ND=Not detected].


                                                           315
   320   321   322   323   324   325   326   327   328   329   330